Menu

1st Interim Report 2018
Open report

Language

Leave

Report switcher allows selecting another report from a different reporting period

1st Interim Report 2018
  • 1st Interim Report 2023
  • Annual Report 2022
  • 3rd Interim Report 2022
  • 2nd Interim Report 2022
  • 1st Interim Report 2022
  • Annual Report 2021
  • 3rd Interim Report 2021
  • 2nd Interim Report 2021
  • 1st Interim Report 2021
  • Annual Report 2020
  • 3rd Interim Report 2020
  • 2nd Interim Report 2020
  • 1st Interim Report 2020
  • Annual Report 2019
  • 3rd Interim Report 2019
  • 2nd Interim Report 2019
  • 1st Interim Report 2019
  • Annual Report 2018
  • 3rd Interim Report 2018
  • 2nd Interim Report 2018
  • 1st Interim Report 2018
  • Annual Report 2017
  • 3rd Interim Report 2017
  • 2nd Interim Report 2017
  • 1st Interim Report 2017
  • Index
  • Search

Table of contents for the 1st Interim Report 2018 report

1st Interim Report 2018
KPIsFinancial review
SummarySegment resultsDepreciation and amortisation, non operating resultsCash flowsBalance sheetOutlook
Consolidated interim financial statements
Consolidated statement of comprehensive income (unaudited)Consolidated balance sheet (unaudited)Consolidated statement of cash flows (unaudited)Consolidated statement of changes in equity (unaudited)
Notes to the interim financial statements
About this report1 Changes in accounting principles2 Segment information3 Operating costs4 Dividends5 Financial instruments and net debt6 Financial result7 Operating net working capital8 Provisions and contingent liabilities
Further information
Share informationQuarterly review 2017 and 2018Forward looking statements
We found 0 search results

No search results. Please enter a different search term.

Share information

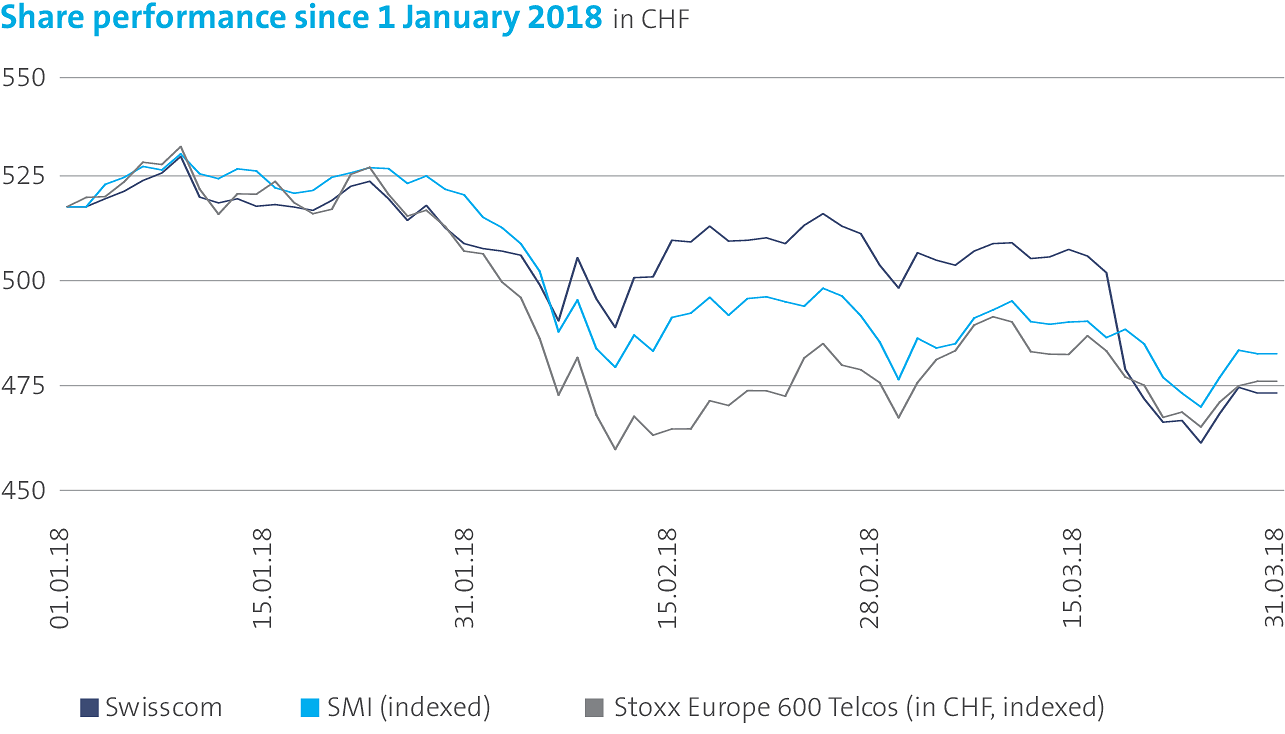
Swisscom share performance indicators

31.12.2017–31.3.2018   SIX Swiss Exchange
Closing price at 31 December 2017 in CHF 1   518.50
Closing price at 31 March 2018 in CHF 1   473.60
Year high in CHF 1   530.60
Year low in CHF 1   460.50
Total volume of traded shares   10,522,278
Total turnover in CHF million   5,292.42
Daily average of traded shares   169,714
Daily average in CHF million   85.36
Source: Bloomberg
1 paid prices

Share performance

WSGE_DP_GR_Aktienkursentwicklung

Financial calendar

  • 16 August 2018 2018 Second-Quarter Results
  • 1 November 2018 2018 Third-Quarter Results
  • 7 February 2019 2018 Annual Results and Annual Report

Stock exchanges

Swisscom shares are listed on the SIX Swiss Exchange under the symbol SCMN (Securities No. 874251). In the United States, they are traded in the form of American Depositary Receipts (ADR) at a ratio of 1:10 (Over The Counter, Level 1) under the symbol SCMWY (Pink Sheet No. 69769).