2 Segment information
General information
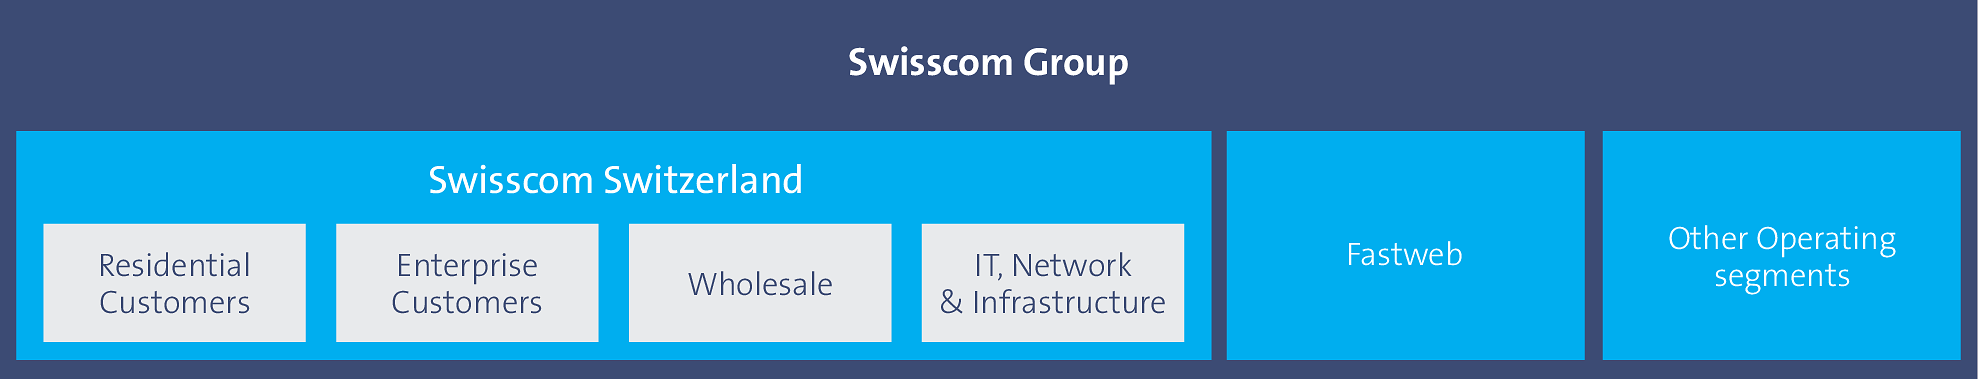
Reporting is divided into the segments “Residential Customers”, “Enterprise Customers”, “Wholesale”, and “IT, Network & Infrastructure”, which are grouped under Swisscom Switzerland, as well as “Fastweb” and “Other Operating Segments”. “Group Headquarters”, which includes non-allocated costs, is reported separately.
Group Headquarters does not charge any management fees to other segments for its financial management services, nor does the IT, Network & Infrastructure segment charge any network costs to other segments. The remaining services between the segments are recharged at market prices. Segment expense encompasses the direct and indirect costs, which include personnel expense, other operating costs less capitalised costs of self-constructed assets and other income. Retirement-benefit expense includes ordinary employer contributions. The difference between the ordinary employer contributions and the pension cost as provided for under IAS 19 is reported in the column “Eliminations”. In the first nine months of 2018, an expense of CHF 46 million is disclosed under “Eliminations” as a pension cost reconciliation item in accordance with IAS 19 (prior year: CHF 75 million). The results of the Residential Customers, Enterprise Customers and Wholesale segments correspond to a contribution margin before network costs. The segment result of IT, Network & Infrastructure consists of operating expenses and depreciation and amortisation less revenues from the rental and administration of buildings and vehicles as well as capitalised costs of property, plant and equipment and other income. The segment results of Swisscom Switzerland and of the Other Operating Segments do not reflect the retirement-benefit reconciliation item in accordance with IAS 19. The segment results of Fastweb correspond to the operating results.
Various areas have been transferred between the segments of Swisscom Switzerland. The prior-year figures have been restated accordingly.
Segment information 2018
2018, in CHF million |
Swisscom Switzerland |
Fastweb |
Other operating segments |
Group Head- quarters |
Elimination |
Total |
||||||
|---|---|---|---|---|---|---|---|---|---|---|---|---|
| Residential Customers | 4,361 | 910 | – | – | – | 5,271 | ||||||
| Corporate Business | 1,737 | 647 | 406 | – | – | 2,790 | ||||||
| Wholesale customers | 434 | 194 | – | – | – | 628 | ||||||
| Net revenue from external customers | 6,532 | 1,751 | 406 | – | – | 8,689 | ||||||
| Net revenue with other segments | 59 | 6 | 248 | 1 | (314) | – | ||||||
| Net revenue | 6,591 | 1,757 | 654 | 1 | (314) | 8,689 | ||||||
| Direct costs | (1,408) | (689) | (43) | – | 21 | (2,119) | ||||||
| Indirect costs 1 | (2,522) | (508) | (472) | (74) | 237 | (3,339) | ||||||
| Segment result before depreciation and amortisation | 2,661 | 560 | 139 | (73) | (56) | 3,231 | ||||||
| Depreciation, amortisation and impairment losses | (1,138) | (432) | (42) | – | 2 | (1,610) | ||||||
| Segment result | 1,523 | 128 | 97 | (73) | (54) | 1,621 | ||||||
| Financial income and financial expense, net | (106) | |||||||||||
| Result of equity-accounted investees | 3 | |||||||||||
| Income before income taxes | 1,518 | |||||||||||
| Income tax expense | (305) | |||||||||||
| Net income | 1,213 | |||||||||||
| Segment result before depreciation and amortisation | 2,661 | 560 | 139 | (73) | (56) | 3,231 | ||||||
| Capital expenditure in property, plant and equipment and intangible assets | (1,102) | (501) | (31) | – | 13 | (1,621) | ||||||
| Change in provisions | (58) | 2 | (1) | 7 | – | (50) | ||||||
| Change in defined benefit obligations | 5 | – | (1) | (2) | 45 | 47 | ||||||
| Change in operating net working capital | (287) | (13) | (1) | 22 | (10) | (289) | ||||||
| Other 2 | (3) | – | – | – | – | (3) | ||||||
| Operating free cash flow | 1,216 | 48 | 105 | (46) | (8) | 1,315 | ||||||
|
1 Including capitalised costs of self-constructed assets and other income.
|
||||||||||||
|
2 Proceeds from the sale of property, plant and equipment, non-cash change in net working capital from operating activities, change in deferred gain from the sale and leaseback of real estate, and dividend payments to owners of non-controlling interests.
|
||||||||||||
Segment information Swisscom Switzerland 2018
2018, in CHF million |
Residential Customers |
Enterprise Customers |
Wholesale |
IT, Network & Infrastructure |
Elimination |
Total Swisscom Switzerland |
||||||
|---|---|---|---|---|---|---|---|---|---|---|---|---|
| Telecom services | 3,906 | 783 | – | – | – | 4,689 | ||||||
| Solution business | – | 768 | – | – | – | 768 | ||||||
| Merchandise | 351 | 153 | – | – | – | 504 | ||||||
| Wholesale | – | – | 434 | – | – | 434 | ||||||
| Other revenue | 104 | 18 | – | 15 | – | 137 | ||||||
| Net revenue from external customers | 4,361 | 1,722 | 434 | 15 | – | 6,532 | ||||||
| Intersegment revenue | 61 | 78 | 244 | 104 | (428) | 59 | ||||||
| Net revenue | 4,422 | 1,800 | 678 | 119 | (428) | 6,591 | ||||||
| Direct costs | (1,003) | (552) | (323) | (8) | 478 | (1,408) | ||||||
| Indirect costs 1 | (827) | (667) | (13) | (965) | (50) | (2,522) | ||||||
| Segment result before depreciation and amortisation | 2,592 | 581 | 342 | (854) | – | 2,661 | ||||||
| Depreciation, amortisation and impairment losses | (109) | (54) | – | (976) | 1 | (1,138) | ||||||
| Segment result | 2,483 | 527 | 342 | (1,830) | 1 | 1,523 | ||||||
| Capital expenditure in property, plant and equipment and intangible assets | (116) | (38) | – | (947) | (1) | (1,102) | ||||||
|
1 Including capitalised costs of self-constructed assets and other income.
|
||||||||||||
Segment information 2017
2017, in CHF million, restated |
Swisscom Switzerland |
Fastweb |
Other operating segments |
Group Head- quarters |
Elimination |
Total |
||||||
|---|---|---|---|---|---|---|---|---|---|---|---|---|
| Residential Customers | 4,456 | 793 | – | – | – | 5,249 | ||||||
| Corporate Business | 1,790 | 569 | 383 | 1 | – | 2,743 | ||||||
| Wholesale customers | 430 | 182 | – | – | – | 612 | ||||||
| Net revenue from external customers | 6,676 | 1,544 | 383 | 1 | – | 8,604 | ||||||
| Net revenue with other segments | 61 | 7 | 229 | 1 | (298) | – | ||||||
| Net revenue | 6,737 | 1,551 | 612 | 2 | (298) | 8,604 | ||||||
| Direct costs | (1,367) | (541) | (23) | – | 20 | (1,911) | ||||||
| Indirect costs 1 | (2,609) | (382) | (460) | (73) | 185 | (3,339) | ||||||
| Segment result before depreciation and amortisation | 2,761 | 628 | 129 | (71) | (93) | 3,354 | ||||||
| Depreciation, amortisation and impairment losses | (1,115) | (427) | (50) | – | 4 | (1,588) | ||||||
| Segment result | 1,646 | 201 | 79 | (71) | (89) | 1,766 | ||||||
| Financial income and financial expense, net | (118) | |||||||||||
| Result of equity-accounted investees | (6) | |||||||||||
| Income before income taxes | 1,642 | |||||||||||
| Income tax expense | (373) | |||||||||||
| Net income | 1,269 | |||||||||||
| Segment result before depreciation and amortisation | 2,761 | 628 | 129 | (71) | (93) | 3,354 | ||||||
| Capital expenditure in property, plant and equipment and intangible assets | (1,083) | (484) | (39) | – | 19 | (1,587) | ||||||
| Change in provisions | (35) | (4) | 2 | (4) | – | (41) | ||||||
| Change in defined benefit obligations | (21) | – | – | (52) | 75 | 2 | ||||||
| Change in operating net working capital | (48) | 16 | (14) | 11 | (11) | (46) | ||||||
| Other 2 | (10) | – | (10) | |||||||||
| Operating free cash flow | 1,564 | 156 | 78 | (116) | (10) | 1,672 | ||||||
|
1 Including capitalised costs of self-constructed assets and other income.
|
||||||||||||
|
2 Proceeds from the sale of property, plant and equipment, non-cash change in net working capital from operating activities, change in deferred gain from the sale and leaseback of real estate, and dividend payments to owners of non-controlling interests.
|
||||||||||||
Segment information Swisscom Switzerland 2017
2017, in CHF million, restated |
Residential Customers |
Enterprise Customers |
Wholesale |
IT, Network & Infrastructure |
Elimination |
Total Swisscom Switzerland |
||||||
|---|---|---|---|---|---|---|---|---|---|---|---|---|
| Telecom services | 4,039 | 829 | – | – | – | 4,868 | ||||||
| Solution business | – | 796 | – | – | – | 796 | ||||||
| Merchandise | 304 | 130 | – | – | – | 434 | ||||||
| Wholesale | – | – | 430 | – | – | 430 | ||||||
| Other revenue | 113 | 16 | – | 19 | – | 148 | ||||||
| Net revenue from external customers | 4,456 | 1,771 | 430 | 19 | – | 6,676 | ||||||
| Intersegment revenue | 61 | 81 | 268 | 106 | (455) | 61 | ||||||
| Net revenue | 4,517 | 1,852 | 698 | 125 | (455) | 6,737 | ||||||
| Direct costs | (977) | (536) | (354) | (9) | 509 | (1,367) | ||||||
| Indirect costs 1 | (851) | (693) | (14) | (996) | (55) | (2,609) | ||||||
| Segment result before depreciation and amortisation | 2,689 | 623 | 330 | (880) | (1) | 2,761 | ||||||
| Depreciation, amortisation and impairment losses | (96) | (59) | – | (961) | 1 | (1,115) | ||||||
| Segment result | 2,593 | 564 | 330 | (1,841) | – | 1,646 | ||||||
| Capital expenditure in property, plant and equipment and intangible assets | (125) | (50) | – | (907) | (1) | (1,083) | ||||||
|
1 Including capitalised costs of self-constructed assets and other income.
|
||||||||||||