Share information
Swisscom share performance indicators
31.12.2018–31.3.2019 |
SIX Swiss Exchange |
|
|---|---|---|
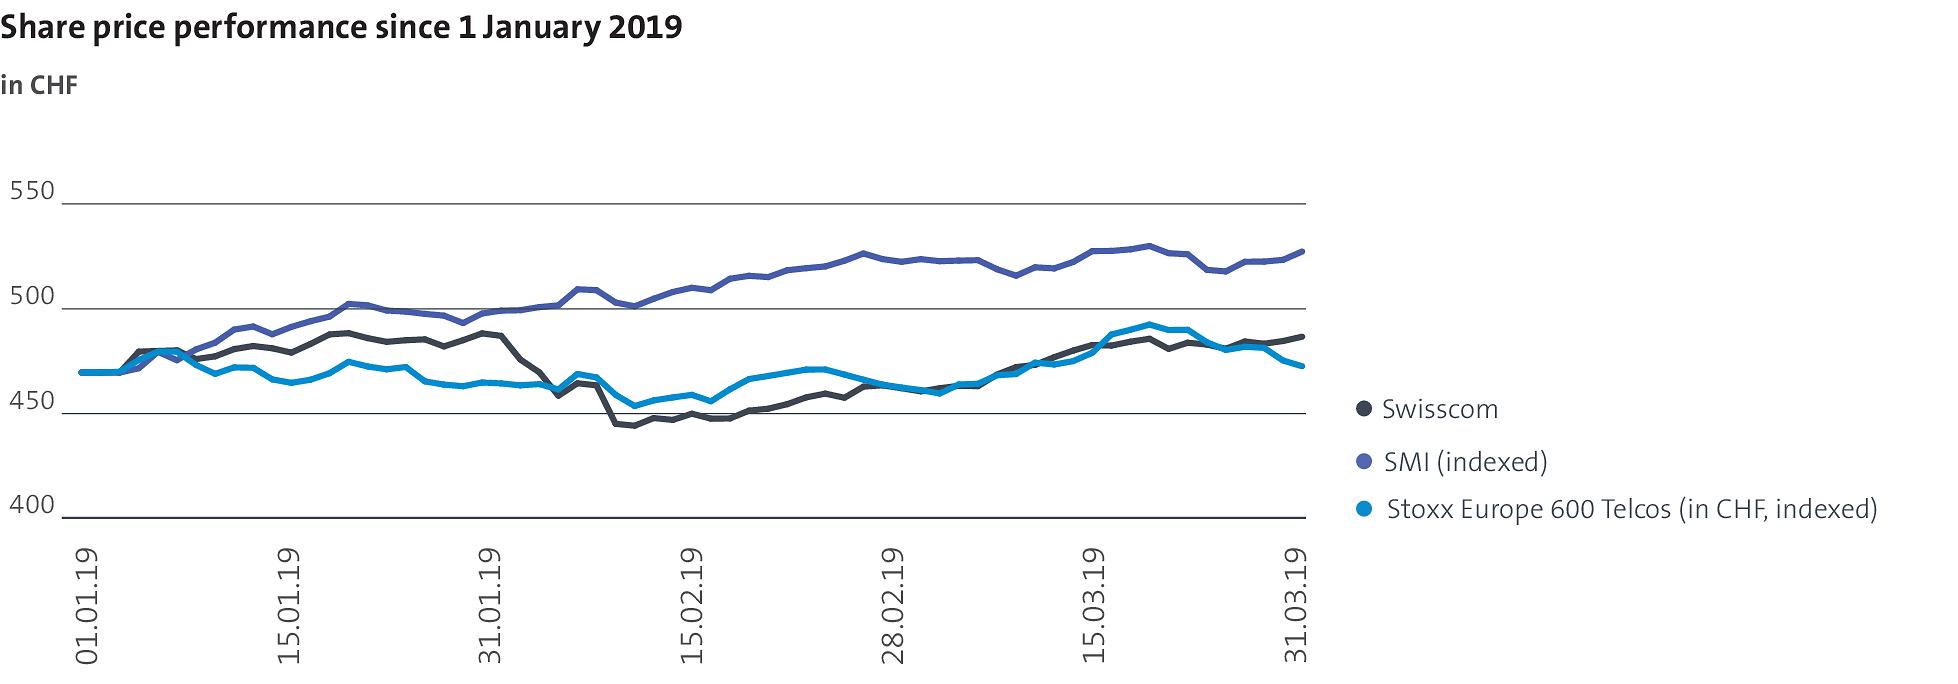
| Closing price as at 31 December 2018 in CHF 1 | 469.70 | |
| Closing price as at 31 March 2019 in CHF 1 | 487.00 | |
| Year high in CHF 1 | 490.80 | |
| Year low in CHF 1 | 441.10 | |
| Total volume of traded shares | 10,287,639 | |
| Total turnover in CHF million | 4,837.06 | |
| Daily average of traded shares | 165,930 | |
| Daily average in CHF million | 78.02 | |
|
Source: Bloomberg
|
||
|
1 paid prices
|
||
Share performance
Financial calendar
- 15 August 2019 2019 Second-Quarter Results
- 31 October 2019 2019 Third-Quarter Results
- 7 February 2020 2019 Annual Results and Annual Report
Stock exchanges
Swisscom shares are listed on the SIX Swiss Exchange under the symbol SCMN (Securities No. 874251). In the United States, they are traded in the form of American Depositary Receipts (ADR) at a ratio of 1:10 (Over The Counter, Level 1) under the symbol SCMWY (Pink Sheet No. 69769).